ANKO Gantt chart
ANKO Gantt chart settles, everyone who suffers from making a WBS!
Didn’t you think that using Redmine Gantt chart is something troublesome or inconvenient?
There are no edit function, but only view functions in Redmine Gantt chart, so when you want to create or correct an issue, you should move another page form there. That had very low efficiencies.
ANKO Gantt chart is the plugin to add creating and editing function to normal “Redmine Gantt chart”.
You can use ANKO Gantt chart to create a WBS very easily, intuitively without moving from a Gantt chart page.
You can register WBS, Schedule management easily without any stress.
ANKO Gantt chart Introduction Video
This video will introduce the main function of the ANKO Gantt chart.
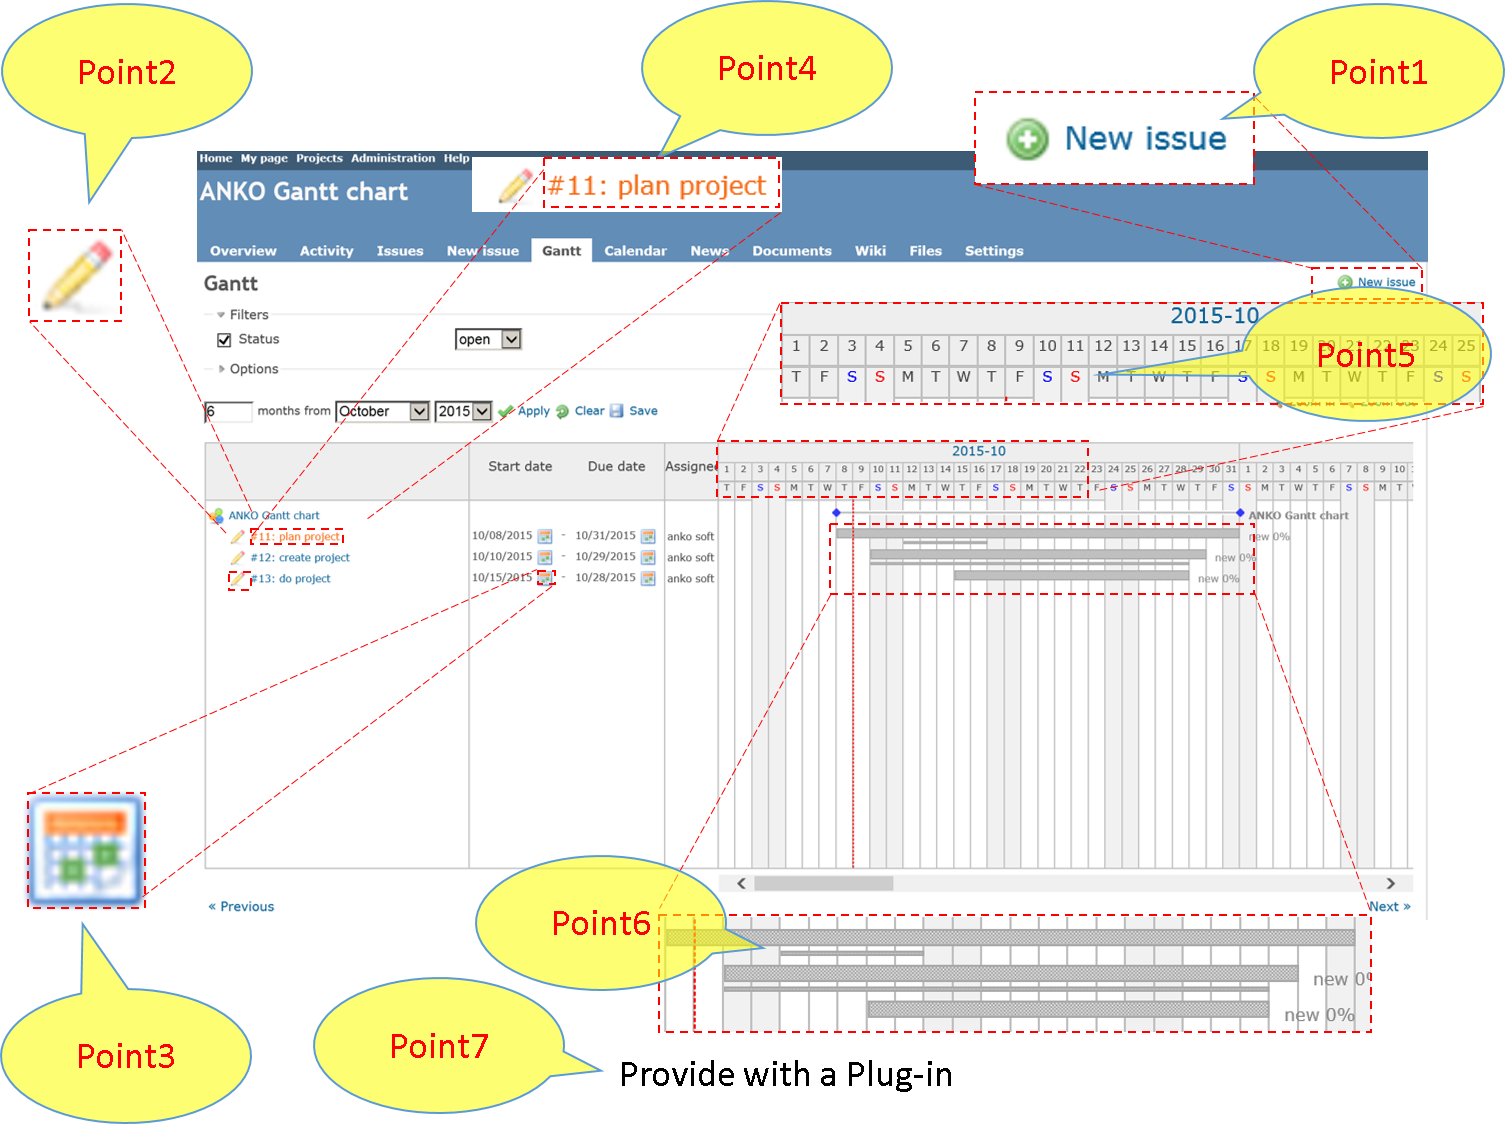
Point 1: Register a new issue
You can quickly and efficiently register a new issue by checking a Gantt chart.
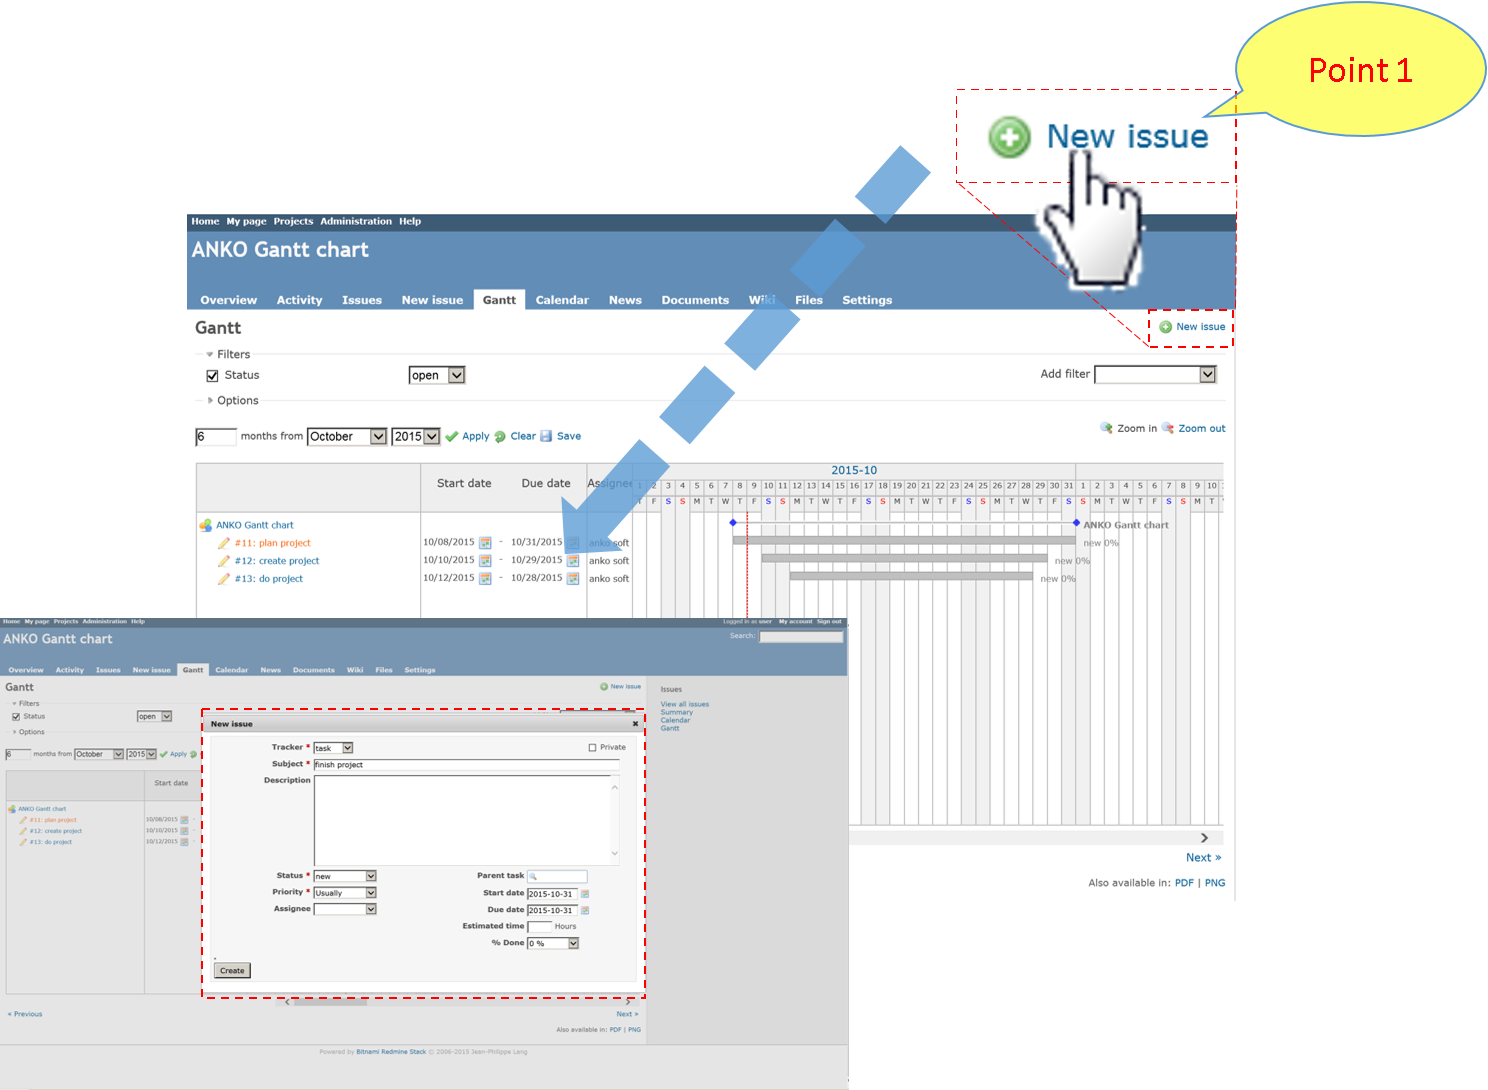

The flow of thought stops, because you should move page twice times to register a new issue in “Redmine Gantt chart”. But the number of times of movement of page does not occur at all in “ANKO Gantt chart”.
And you can make input work efficiently in “ANKO Gantt chart”, because the click number of times is less then that.
Point 2: Register a subtask
You can register a hierarchical issue like as WBS efficiently, because you can register a subtask immediately while checking the Gantt chart.
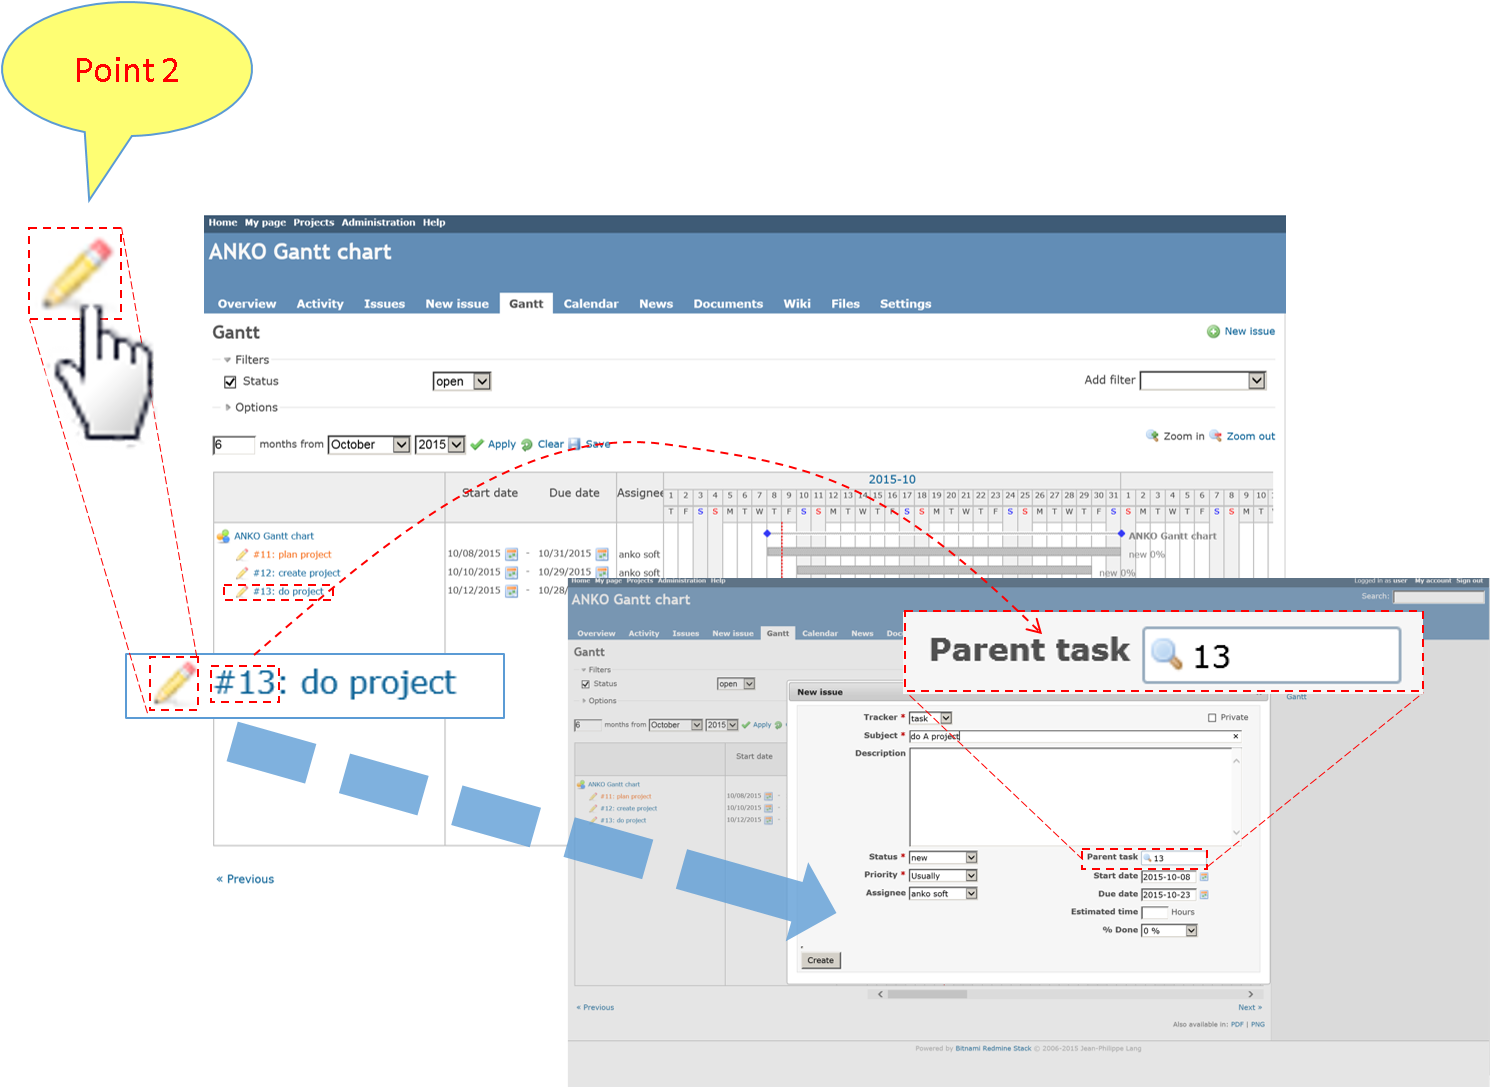

And you can make input work efficiently in “ANKO Gantt chart”, because the click number of times is less than that.
Point 3: Change Start and Due dates
When you click the “calendar” icon next to the Start and Due dates, you can change Start and Due dates of issue on the same page by selecting the day in the calendar.
You can change easily the schedule of an individual issue, even a lot of changes in the schedule. Because changed Start and Due dates are reflected in Gantt chart immediately.

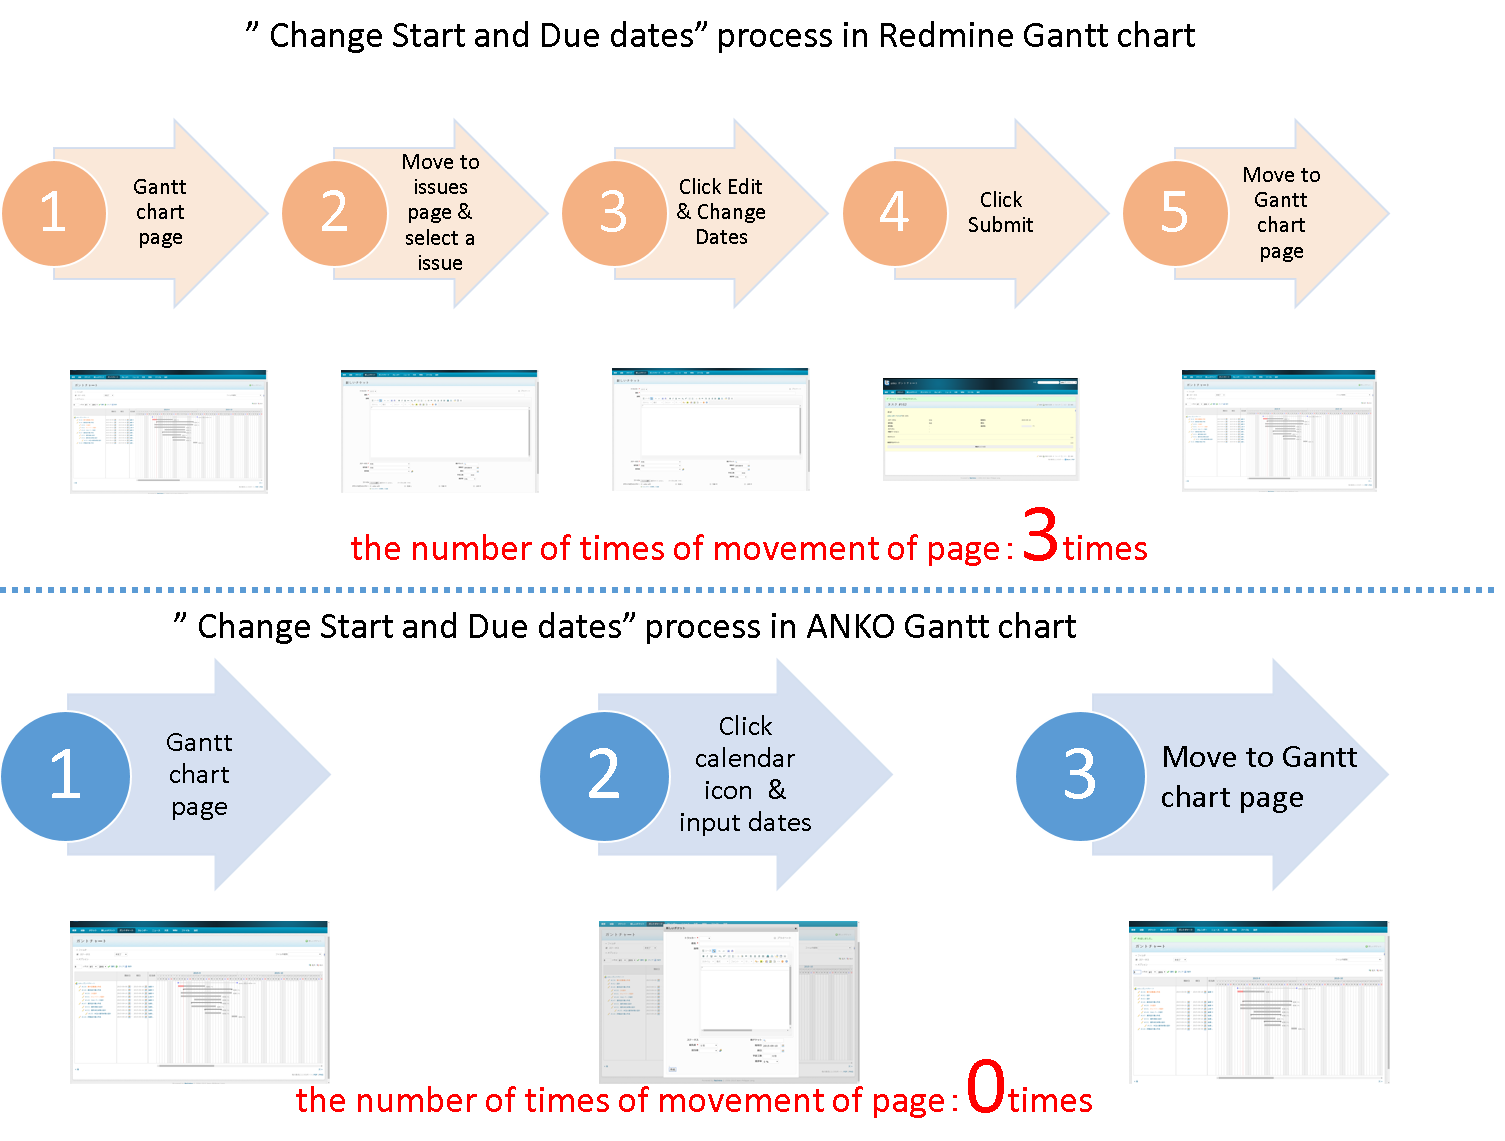
And you can make input work efficiently in “ANKO Gantt chart”, because the click number of times is less than that.
Point 4: Change issue contents
You took time and effort to change the issue continuously in Gantt chart page of Redmine, because you should move to the issues detail page to change, after registering, you have to move to the Gantt chart page once again. But if you use ANKO Gantt chart, you can change the issue only in Gantt chart page, so you can operate intuitively.
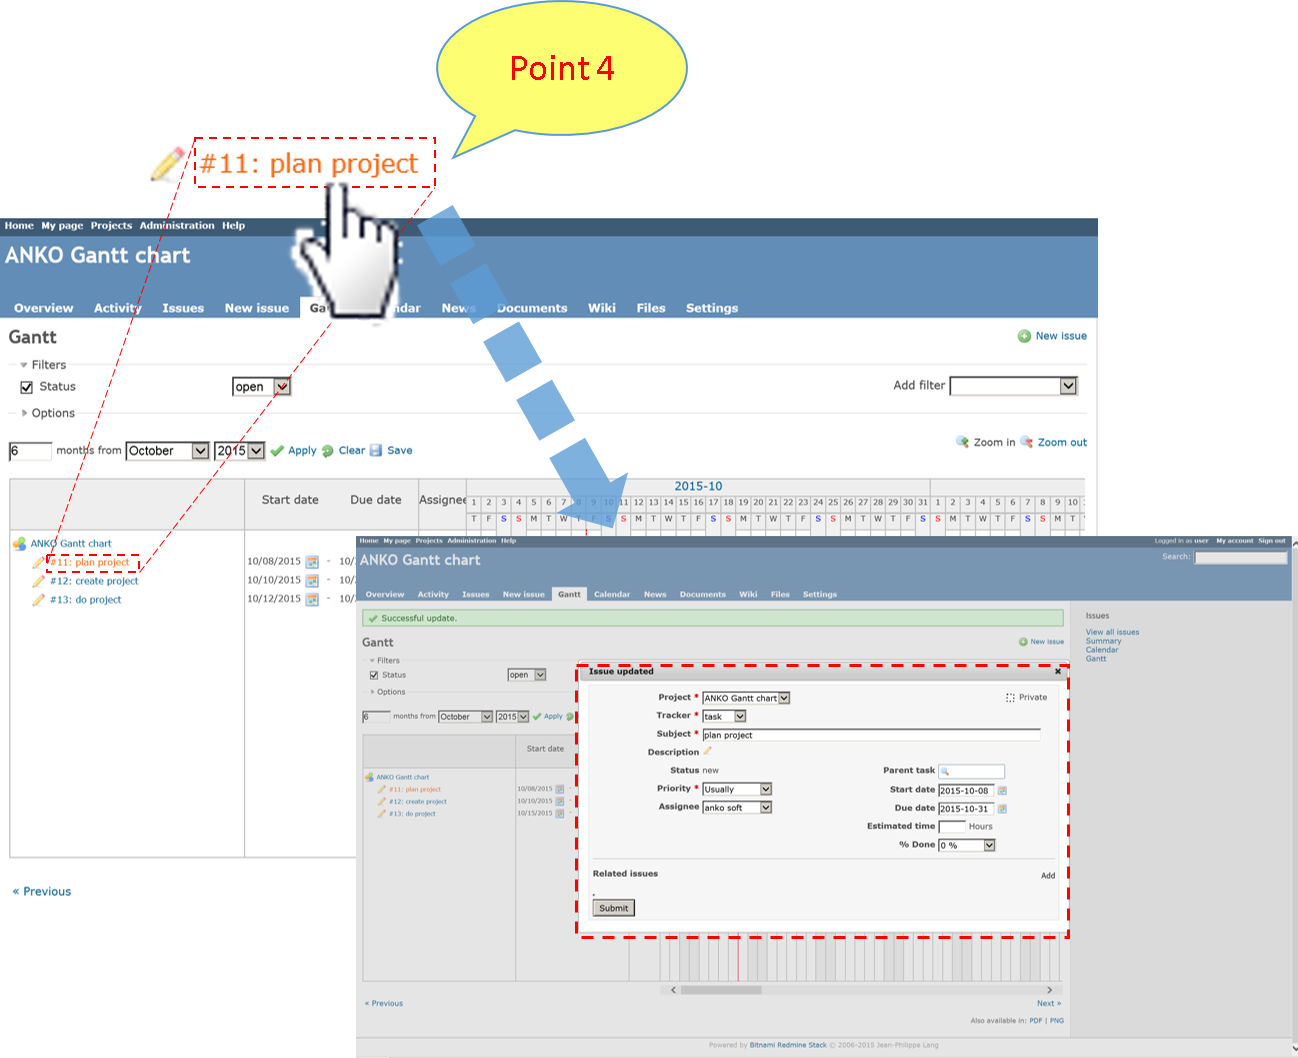

ANKO Gantt chart can also reduce the click number of times, so you can do input work efficiently.
Point 5: Date indicated
ANKO Gantt chart can provide a function to show monthly, weekly and daily timeline, so you can confirm the schedule at once and easily.

But, ANKO Gantt chart provides a function to show daily timeline. You can make a schedule correctly, because you can confirm the schedule in Gantt chart page.
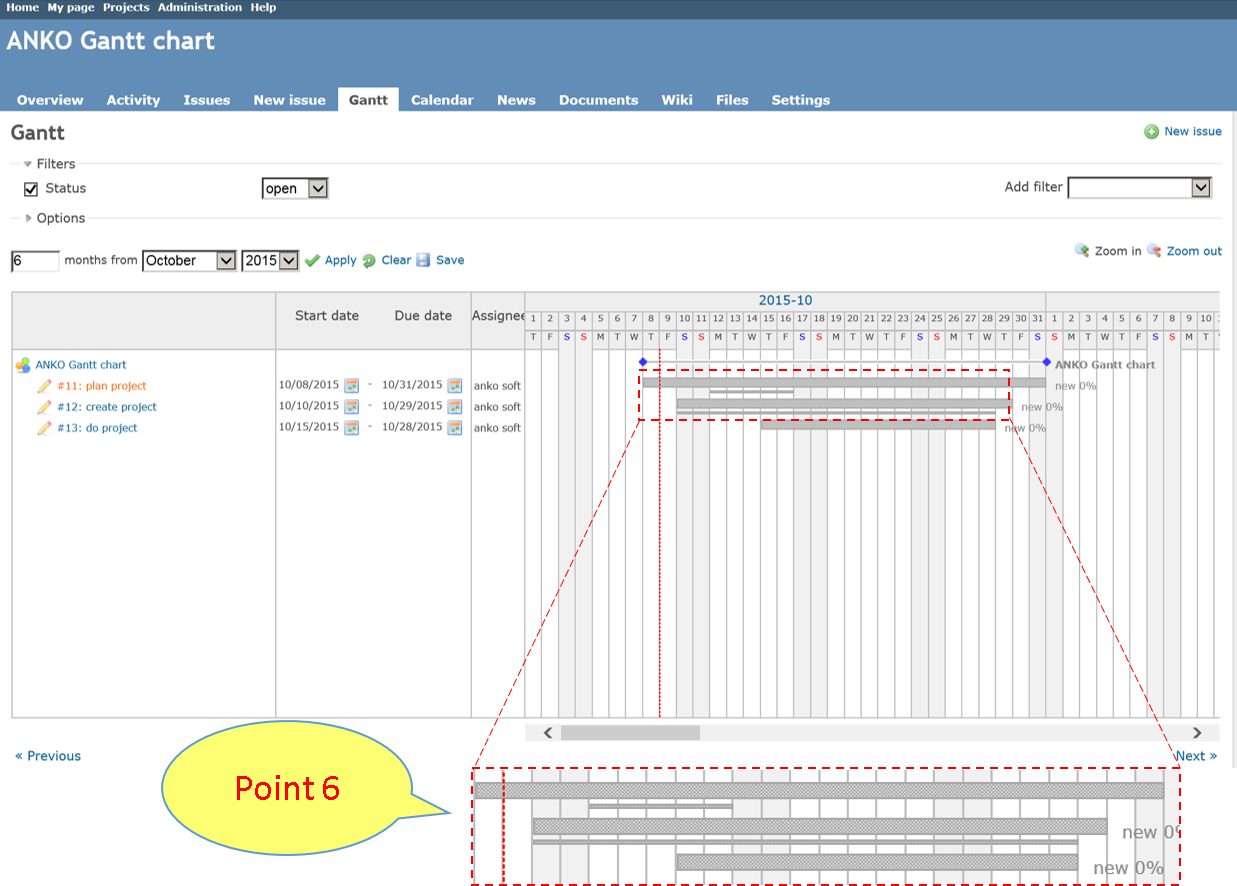
Point 6: Scheduled Start and Due of Date indicated
ANKO Gantt chart can show two charts with one issue. Therefore, you can confirm the estrangement of progress from a schedule in visual way with showing scheduled Start and Due dates at the plan stage.
A thick line shows a Start and Due dates of an actual issue, and a thin line under it shows scheduled Start and Due dates.
Point 7: Provide with a Plug-in
It will not change DB, so you can install it very easily. You just copy the file we provide to a plug-in folder and make a server restart. Now you can use it already.
IT’s not necessary to change the setting of Redmine, because of plug-in.
You can use ANKO Gantt chart continuously after your Redmine upgrades, because it does not change Redmine body, because of plug-in.
Specification of ANKO Gantt chart
| Redmine version | Redmine2.x, Redmine3.x |
| LICENSE | SERVER LICENSE |
Price
$ 500 (U.S. $)
CONTACT US
Ankosoft Inc.
TEL : 81-44-223-6484(Japan)
EMAIL : info@ankosoft.co.jp